7 Cycles Settings to Speed Up Renders on a Render Farm
Published on
Every week, dozens of Blender projects land on our render nodes. Some of them fly through, frames done in seconds, clean results, happy artists. Others crawl. Not because the scenes are particularly heavy, not because they lack GPU power, but because the render settings inside the .blend file are configured as if they're running on a laptop from three years ago. And sometimes it's the opposite problem: every quality slider cranked to the maximum, convinced that bigger numbers always mean better results, when in reality they just mean more money spent and more time wasted with zero visible improvement in the final image.
This guide covers the seven most impactful Cycles settings to get right before submitting a project to BoltRenders. They're all right there in the Render Properties panel, easy to overlook, and expensive to get wrong.
Always set Device to "GPU Compute"
This one might seem obvious, but you'd be surprised how often we receive projects with the render device still set to CPU. The reason is simple: Blender defaults to CPU rendering, and if you developed your project on a machine without a capable GPU, or with CUDA/OptiX disabled, you may never have changed it.
On BoltRenders, every render node is equipped with high-end professional GPUs. Leaving the device set to CPU means you're completely ignoring the hardware that makes our farm fast. You're essentially renting a sports car and driving it in first gear. GPU-accelerated Cycles rendering with OptiX or CUDA can be anywhere from 5x to 50x faster than CPU rendering, depending on the scene. There is virtually no scenario where CPU rendering is preferable on our infrastructure.
Go to the top of Render Properties, find the "Device" dropdown, and set it to GPU Compute. Do this first, before anything else.
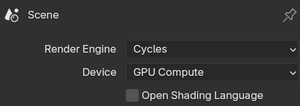
OSL: only enable it if you actually use it
Open Shading Language (OSL) is a powerful scripting system that lets you write custom shader code in .osl files and plug them directly into your material network. For certain procedural effects and custom looks, it's genuinely invaluable. But the checkbox in Render Properties comes with important caveats that are worth understanding before you submit.
OSL is not supported with GPU rendering unless you are using the OptiX backend. Blender This means that if your system is set to CUDA rendering (which is also a GPU option, just not OptiX), enabling OSL will not work as expected. OSL GPU support requires an NVIDIA GPU with OptiX selected as the compute backend. On BoltRenders, our nodes run OptiX, so OSL does work on GPU here, but only under that specific condition. If you enable OSL without actually having any .osl script nodes in your scene, you're simply adding overhead for no reason.
There are also features that are not available when using the OptiX backend with OSL, including memory usage reductions offered by on-demand texture loading and certain noise functions. So even when it does work on GPU, it's not a full-featured implementation.
The more dangerous issue is the OptiX data size limit. Enabling the OSL checkbox in Cycles can trigger a "requested OSL group data size is greater than the maximum supported with OptiX (2048)" error. This doesn't just happen when your .osl scripts are large: it can be triggered by the cumulative complexity of your entire shader graph once OSL mode is active. A complex node setup with many materials can hit this ceiling even without a single custom .osl script in sight, which is a particularly frustrating way to have your render fail.
The rule is simple: if you are not using .osl Script nodes anywhere in your shader editor, leave the OSL checkbox in Render Properties off. If you do use OSL, verify that your scene compiles cleanly under OptiX before submitting, keep your shader graphs as lean as possible, and be aware that some OSL features available on CPU will behave differently or be unavailable on GPU.
Use Adaptive Sampling intelligently
When Cycles renders an image, it works by casting a large number of light rays (samples) through each pixel and averaging the results to compute the final color. The more samples a pixel gets, the more accurate and noise-free its result becomes. The problem is that not every pixel needs the same number of samples to converge: a plain white wall under direct light may be perfectly stable after a handful, while a dark corner with complex glossy reflections and indirect bounces might need hundreds more to stop flickering with noise.
By default, Cycles ignores this and distributes samples uniformly across every pixel up to the fixed number you specify. Adaptive Sampling, found in Render Properties under Sampling → Render, changes this fundamentally. It tracks the statistical variance of each pixel as samples accumulate and stops sampling that pixel once its noise falls below a specified threshold. The sample budget gets spent where it actually matters, and pixels that don't need more work are left alone. For any scene of meaningful complexity, this translates directly into shorter render times with no perceptible quality loss.
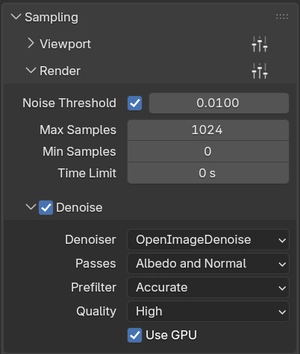
When tuning the two key parameters, the objective is to find the leanest configuration that still produces a genuinely clean image. The Noise Threshold controls when a pixel is considered converged: lower values demand more convergence before stopping, producing cleaner results at the cost of more samples. Max Samples is the hard ceiling for any pixel that is slow to converge. Both values need to be dialed in together, testing on representative frames, until the output is clean without doing a single unnecessary sample.
That cleanliness matters beyond just efficiency. The denoiser works best when it has a reasonably clean image to start from. The more noise it has to correct, the more it has to interpolate and guess, and in animations that shows up as temporal instability between frames, the boiling or flickering look that no amount of post-processing fully fixes. A well-tuned Adaptive Sampling setup minimizes the denoiser's workload and gives it the best possible input to work with.
Finally, if you are using OpenImageDenoise, make sure to enable "Use GPU" in the Denoising subpanel. There is no reason to let the CPU handle that pass while your GPU sits idle.
Move the Compositor and Denoise Nodes to GPU
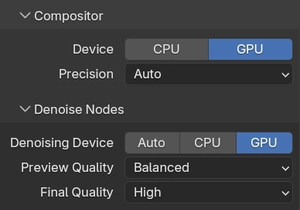
Blender 3.5 and later introduced the ability to run the Compositor and Denoise nodes on the GPU rather than the CPU. These are post-processing operations that happen after the render itself, covering compositing effects like glare, color correction, lens distortion, and the denoising passes, and they can add meaningful overhead to each frame's total processing time.
By default, these operations often run on the CPU, which means that after your GPU finishes rendering at full speed, it sits idle while the CPU chugs through compositing work. On a farm node with a powerful GPU and a comparatively slower CPU, this imbalance is particularly noticeable.
In Render Properties under Performance, you'll find Compositor and Denoise Nodes subpanels. In both you should set their "Device" to be GPU. This keeps the entire pipeline (render, denoise, composite) running on the GPU from start to finish, maximizing throughput per frame.
Set Threads Mode to "Auto-Detect"
When you install Blender on a local machine, the Threads Mode under Render Properties → Performance → Threads may be set to a fixed number, perhaps 8 or 16 threads, matching your laptop's core count. That number gets saved into the file and uploaded to the farm, where it promptly ignores the 64 or 128 CPU threads actually available on the node.
While CPU threads aren't the primary bottleneck for GPU rendering, they still play an important role in scene loading, BVH construction, memory management, and certain non-GPU tasks that happen between and during frames. Capping thread count to a stale local value is needlessly limiting.
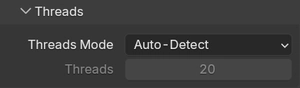
Setting Threads Mode to Auto-Detect tells Blender to query the host machine at runtime and use as many threads as are available. On our nodes, that means Blender gets the full core count every time, automatically, regardless of what machine the file was created on. It's a small change, but it costs you nothing and guarantees you're not artificially bottlenecking the CPU-side work.
Set Tile Size to 1024 or 2048 (or higher)
This is possibly the most impactful single setting for render farm performance, and also the most commonly misconfigured.
Cycles divides the render output into rectangular tiles and processes each tile sequentially. The Tile Size, found in Render Properties under Performance → Memory, determines how large each of these tiles is. On a modest local GPU, small tiles (256x256 or even 128x128) make sense because a small tile fits entirely in the GPU's active cache, minimizes memory pressure, and keeps the hardware humming without hiccups.
On a render farm node with a high-end GPU and substantial VRAM, small tiles are actively counterproductive. Instead of filling the GPU's massive parallel compute capacity with a large, rich slab of work, you're feeding it tiny morsels one after another, constantly loading and unloading tile data, creating overhead with every context switch. The GPU never gets to stretch its legs. It's like serving a banquet one crouton at a time.
For BoltRenders nodes, the sweet spot is generally 2048x2048. This gives the GPU a large, coherent block of work to process at once, fills VRAM efficiently, and dramatically reduces the number of tile-loading cycles per frame. For extremely VRAM-heavy scenes (think dense particle systems, high-res displacement, complex volumes) drop to 1024x1024 to avoid memory pressure. For lighter scenes, you can try values above 2048.

Two rules to always follow: use powers of 2 (512, 1024, 2048, 4096), and keep total VRAM usage comfortably below 20 to 24 GB during rendering to avoid spilling to system memory, which will negate much of the performance gain.
Use "Persistent Data" wisely, it's a double-edged sword
When Blender renders an animation frame by frame, it can either discard all scene data from memory after each frame and reload it fresh for the next one, or hold onto it. The Persistent Data option, found in Render Properties under Performance → Final Render, controls this behavior, and understanding when to enable or disable it can have an enormous impact on animation render times.
By default, Blender tears everything down between frames and rebuilds from scratch. For simple or static scenes this is enormous waste: loading the same meshes, textures, and BVH acceleration structures over and over, frame after frame, spending several seconds of overhead per frame just re-preparing data that hasn't changed at all.

With Persistent Data enabled, Blender keeps the scene data in memory across frames. The BVH doesn't get rebuilt. Meshes don't get reloaded. For animations where the camera moves through a largely static environment (an architectural flythrough, a product visualization, a character animation with a stable background) this can reduce per-frame overhead dramatically, cutting significant time off the total animation render.
However, Persistent Data has a real downside: memory accumulation. If your scene has a lot of dynamic objects (particles, procedural geometry, complex simulations, lots of visibility changes between frames) keeping all that data persistent means it piles up in VRAM over time. On a long render job, this can lead to out-of-memory crashes, or simply cause the render to slow down progressively as VRAM fills. For highly dynamic scenes, it's better to leave Persistent Data disabled and pay the per-frame reload cost.
The simple decision rule: enable it when the same meshes are visible across most frames. Disable it when the scene has many object changes, heavy simulations, or long sequences where memory accumulation is a real risk.
Conclusions
Before you submit your next project to BoltRenders, run through these seven points and make sure each one is correct. This takes about two minutes in Blender and can save hours of unnecessary render time, which means real money saved.
None of these settings require artistic compromise. They don't change what your render looks like. They change how efficiently the hardware gets there. And on a render farm with serious GPU hardware at its disposal, efficiency isn't just nice to have, it's the whole point.
If you have questions about any of these settings, or you're not sure how to apply them to a specific type of scene, our support team is always here to help. We've seen a lot of projects, and we're happy to take a look at yours.